SEA-LEVEL FALL/RISE
The title of this article has been chosen to surprise where the title “tectonic uplift and sea level” would have raised few eyebrows. The two phrases "tectonic uplift" and "sea level fall" have an identical meaning in the sense that where the land has risen relative to sea level, sea level has fallen relative to the land. There is no datum which can be regarded as fixed. Rises, falls and bendings of the Earth’s crust mean that although surveyors can now measure very accurately the differences in level between places several km apart, they can only measure those differences with respect to each other or measure both with respect to some arbitrary datum. "Mean Sea Level" (MSL) or "Mean High Water Spring" (MHWS) are commonly used as a datum - but this aspect, and the curvature of the Earth etc is not what this article is about!
It has long been known that much of NZ is rising as the Pacific Plate and Australian Plate push against each other and slide relative to each other. There are exceptions such as the Marlborough Sounds where the land has been sinking relative to mean sea level for thousands of years and this explains why beaches are so poorly-formed there.
At Algies Bay there is (I will be suggesting) a variety of evidence for a substantial lowering of the rock surface beneath the sand relative to the land - and in particular relative to many concrete structures tied to the land. Though initially seen as sea level FALL (relative to the adjacent land) further observation has pointed to it being mostly traceable to mechanical slaking of the rocks beneath the sand as a result of them being exposed more often and for longer periods to drying resulting from loss of sand cover. Increased exposure to drying at low tides has increased the rate at which the exposed rock suffers mechanical slaking. This process of rock disintegration has been described in the article on The Rocks.
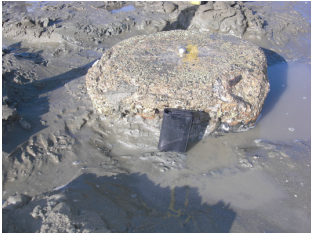
The Survey datum mark
In the summer of 2011-2012 it was noticed that, at low tide, a stainless steel survey mark (RM 1 SO 57443) and its circular concrete surround were standing about 100mm above the surrounding rock, see photo and sketch below. This was of local significance because the mark was where many dinghy owners brought their boats onto a conveniently-sloping stretch of sand near the central boat-ramp. At quarter tides there was an obvious danger of damage being caused to outboard motors and to the hulls of the boats.
The situation was remarked upon by people who walked on the Beach daily, including the Writer who had walked his dog nearby on the sand at low tide and on the shore at high tide daily for 19 years.
|
|
Survey Datum before lowering
Surveyors would not have placed such a thing elevated like that: they would have built it so that their concrete was flush with the rock surface. The rock surface had apparently wasted down relative to the deeper unexposed rock on which the concrete was still resting.
Buckton Consulting Surveyors very kindly lowered the survey mark by about 105mm – after obtaining permission from the Surveyor General. They chipped away the concrete and sawed through the stainless steel pin. The marker is now usually buried under mud, silt and sand, and will not now pose a danger for many years even when the mud, silt and sand are "out".
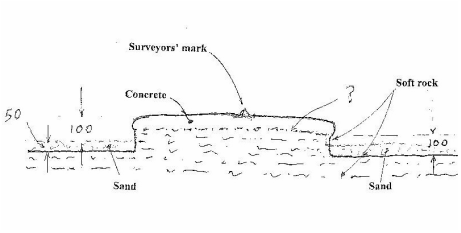
The exposed beam and piles
Another surprise in the same summer was the exposure of the top 50 – 70mm of concrete piles beneath the concrete beam supporting the sea wall nearby, see photo below.
These two new developments (the exposed survey datum and the piles) were visible only when the sand was “out”.
Examination of the sea wall showed differences in texture of its concrete surface where concrete had been poured –
• against a smooth surface such as would be formed by excavation of a trench in the siltstone for the beam on which the wall was to be founded, and
• against planks to form the retaining wall - which is about 1.2m high. The usual marks made by the edges of timber plank boxing are clearly visible.
It appears that the trench was excavated and vertical holes drilled through its bottom with a post-hole borer, and that concrete was then poured to form the piles and beam. (The concrete for the wall from the beam upwards was probably poured a few days later.) This would be normal procedure at the time (late 1950’s) and indeed today.
Buckton Consulting Surveyors very kindly lowered the survey mark by about 105mm – after obtaining permission from the Surveyor General. They chipped away the concrete and sawed through the stainless steel pin. The marker is now usually buried under mud, silt and sand, and will not now pose a danger for many years even when the mud, silt and sand are "out".
The exposed beam and piles
Another surprise in the same summer was the exposure of the top 50 – 70mm of concrete piles beneath the concrete beam supporting the sea wall nearby, see photo below.
These two new developments (the exposed survey datum and the piles) were visible only when the sand was “out”.
Examination of the sea wall showed differences in texture of its concrete surface where concrete had been poured –
• against a smooth surface such as would be formed by excavation of a trench in the siltstone for the beam on which the wall was to be founded, and
• against planks to form the retaining wall - which is about 1.2m high. The usual marks made by the edges of timber plank boxing are clearly visible.
It appears that the trench was excavated and vertical holes drilled through its bottom with a post-hole borer, and that concrete was then poured to form the piles and beam. (The concrete for the wall from the beam upwards was probably poured a few days later.) This would be normal procedure at the time (late 1950’s) and indeed today.
Exposed pile beneath beam
I had not noticed the exposed concrete piles, or the danger posed by the elevated survey mark in the preceding 16 years. The wall was built ca 1965 ie about 50 years ago, and the sand had been “out” many times in that 16 years I had been walking our dog on the beach there. But maybe it had only in recent months (or year or two) been out so often or so far.
Further away from the central ramp (see near Nos 18 and 20 Gordon Craig Place) the siltstone surface (exposed by the sand being “out”) was, and still is, at the level of the TOP of the beam.
Further away from the central ramp (see near Nos 18 and 20 Gordon Craig Place) the siltstone surface (exposed by the sand being “out”) was, and still is, at the level of the TOP of the beam.
Weathered siltstone still level with top of trench/beam. Maybe mechanical slaking had been reduced
by seepage from ground-water drain above it as well as by products of weathering blocking pores
in siltstone and preventing air entry into them.
by seepage from ground-water drain above it as well as by products of weathering blocking pores
in siltstone and preventing air entry into them.
Evidently the surface of the siltstone was (in Nov 2011) very little lower than it was when the trench was excavated (ca 1960) and the concrete beam poured.
It has yellow seams rather than grey ie it has oxidized. Weathering (oxidation etc) creates clay-sized material on the surfaces of the silt grains which blocks the pores between silt grains thereby preventing air entering the siltstone and removing the possibility of water subsequently moving up those pores (pulled by meniscus action) and trapping air in them as the tide returns back in. That process causes high air pressures to form and they “blast” the siltstone apart ie it disintegrates (see above under Rocks). So the blocking of the pores by oxides formed in the dried pores between silt grains explains why it has not undergone disintegration by mechanical slaking; the water of the incoming tides couldn’t get up there and compress the air which would have blasted the siltstone apart.
The boat-ramps
Several houses have boat ramps, most leading up to boatsheds. All of them have been extended seawards in the 50 – 60 years since they were built, some of them more than once, see photo below.
People are very unlikely to build such ramps on sand. The sand is pushed aside and the concrete poured on the rock, in this case mostly siltstone which undergoes rapid mechanical slaking ie disintegration if re-wet after drying. Some of the longer boat-ramps developed gaps on their sides so that seawater could flow underneath the concrete. This led to the rock beneath it being removed and the concrete slab above it collapsing.
It was unlikely that scour by wave action could be responsible for this erosion of rock in what were very protected areas beneath concrete. However, once it was appreciated that the siltstone was very susceptible to mechanical slaking it was realized that at all three locations (i) beside the survey mark, (ii) adjacent to the seawall and (iii) under the boat-ramp, a drying of the rock would occur at low tide (when the sand was “out”) and a re-wetting when the tide came back in. Even removing only 20th of a millimeter on each cycle of drying and re-wetting the rock surface would be lowered by one mm every 10 days. Just one period of the sand being “out” for a few months could cause major changes.
A lowering of the rock surface has occurred over the last 18 years around the boat-ramp at 4 Gordon Craig Place. In 1995 on days when the sand was “out” there was a step of about 20mm from the end of the concrete down to the siltstone. That step is now 150mm high and the rock is beginning to disappear from under the concrete which was newly-poured ca 1990.
All of the concrete boat-ramps have been added to over the years, some of them several times. Those involved in building them have said that the concrete for ramp extensions was poured onto rock NOT onto sand. So it is not a case of wave action scouring sand from beneath the concrete but of the siltstone (rock) undergoing the mechanical disintegration which it is very susceptible to (see photos in The Rocks article of samples disintegrating when dried and re-wet) during the daily drying out of its surface when the tide is out and being re-wet as it comes in. On the Beach, during the daily drying out of its surface when the tide is out the re-wetting when it comes in, the same process is likely to occur. Even if a layer only (say) 0.05mm thick is dried each time that’s 2 x 0.05 x 365 = 36.5mm per year. That’s assuming that the sand is “out” for the 365 days and 36 days may be a better guesstimate. So 3.65 ie 3 or 4mm per year. This undermining of boat ramps has been more noticeable in the last few years than it was over the previous decade. It is more noticeable now (Dec 2014) than it has ever been.
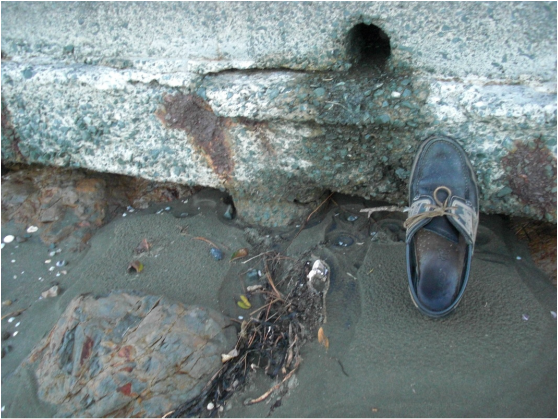
The rock wall at No 14 Gordon Craig Place
The builder of this rock wall (1) (built in 1995) is adamant that he placed those rocks on rock rather than on sand. Over the 20 years the wall has been there, and particularly noticeably in the last few years, the natural ("seabed") rocks under the wall, which have been alternately dried and re-wet by tidal action have wasted away and left the bottom row of imported Greywacke (non-slaking) rocks without support – indeed about 80-100mm above the rock beneath, see photo below.
It has yellow seams rather than grey ie it has oxidized. Weathering (oxidation etc) creates clay-sized material on the surfaces of the silt grains which blocks the pores between silt grains thereby preventing air entering the siltstone and removing the possibility of water subsequently moving up those pores (pulled by meniscus action) and trapping air in them as the tide returns back in. That process causes high air pressures to form and they “blast” the siltstone apart ie it disintegrates (see above under Rocks). So the blocking of the pores by oxides formed in the dried pores between silt grains explains why it has not undergone disintegration by mechanical slaking; the water of the incoming tides couldn’t get up there and compress the air which would have blasted the siltstone apart.
The boat-ramps
Several houses have boat ramps, most leading up to boatsheds. All of them have been extended seawards in the 50 – 60 years since they were built, some of them more than once, see photo below.
People are very unlikely to build such ramps on sand. The sand is pushed aside and the concrete poured on the rock, in this case mostly siltstone which undergoes rapid mechanical slaking ie disintegration if re-wet after drying. Some of the longer boat-ramps developed gaps on their sides so that seawater could flow underneath the concrete. This led to the rock beneath it being removed and the concrete slab above it collapsing.
It was unlikely that scour by wave action could be responsible for this erosion of rock in what were very protected areas beneath concrete. However, once it was appreciated that the siltstone was very susceptible to mechanical slaking it was realized that at all three locations (i) beside the survey mark, (ii) adjacent to the seawall and (iii) under the boat-ramp, a drying of the rock would occur at low tide (when the sand was “out”) and a re-wetting when the tide came back in. Even removing only 20th of a millimeter on each cycle of drying and re-wetting the rock surface would be lowered by one mm every 10 days. Just one period of the sand being “out” for a few months could cause major changes.
A lowering of the rock surface has occurred over the last 18 years around the boat-ramp at 4 Gordon Craig Place. In 1995 on days when the sand was “out” there was a step of about 20mm from the end of the concrete down to the siltstone. That step is now 150mm high and the rock is beginning to disappear from under the concrete which was newly-poured ca 1990.
All of the concrete boat-ramps have been added to over the years, some of them several times. Those involved in building them have said that the concrete for ramp extensions was poured onto rock NOT onto sand. So it is not a case of wave action scouring sand from beneath the concrete but of the siltstone (rock) undergoing the mechanical disintegration which it is very susceptible to (see photos in The Rocks article of samples disintegrating when dried and re-wet) during the daily drying out of its surface when the tide is out and being re-wet as it comes in. On the Beach, during the daily drying out of its surface when the tide is out the re-wetting when it comes in, the same process is likely to occur. Even if a layer only (say) 0.05mm thick is dried each time that’s 2 x 0.05 x 365 = 36.5mm per year. That’s assuming that the sand is “out” for the 365 days and 36 days may be a better guesstimate. So 3.65 ie 3 or 4mm per year. This undermining of boat ramps has been more noticeable in the last few years than it was over the previous decade. It is more noticeable now (Dec 2014) than it has ever been.
The rock wall at No 14 Gordon Craig Place
The builder of this rock wall (1) (built in 1995) is adamant that he placed those rocks on rock rather than on sand. Over the 20 years the wall has been there, and particularly noticeably in the last few years, the natural ("seabed") rocks under the wall, which have been alternately dried and re-wet by tidal action have wasted away and left the bottom row of imported Greywacke (non-slaking) rocks without support – indeed about 80-100mm above the rock beneath, see photo below.
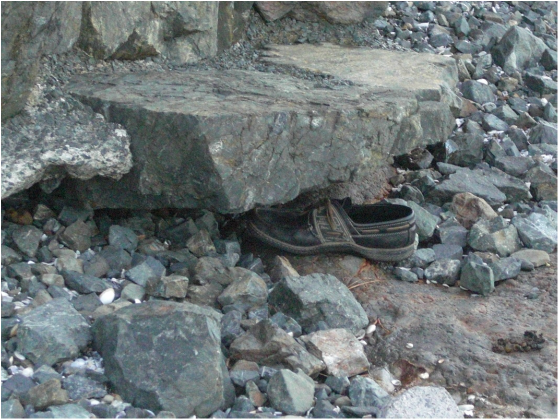
Surface of siltstone (beneath shoe) 80mm below underside of rock
which rested on it in 1995
which rested on it in 1995
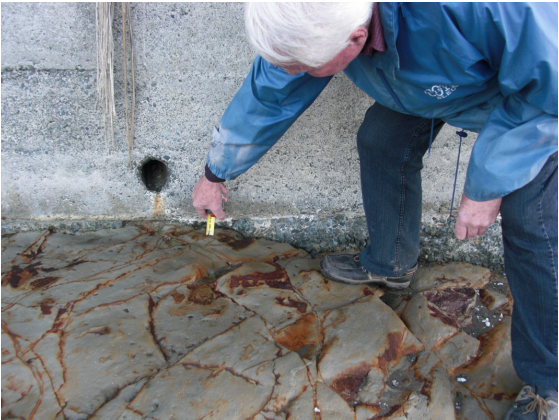
The “mains” sewer
This was buried in the Beach near high-tide level in the 1980’s and is now very exposed when the sand is “out”. It is unlikely that Council would have built it like that. The relative erodibility of the different rocks used to “pave” it may be seen, along with the contrasts between them and the concrete matrix locating them. My impression is that the sewer line had become more visible/prominent over the last 20 ears (1995 - 2015).
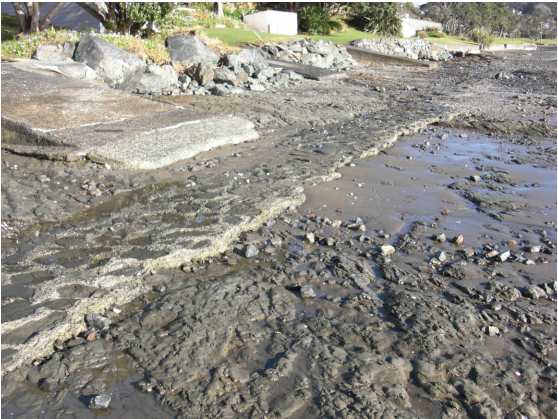
The 1980s sewer emerging from the siltstone. Note also a thrice-extended
boat-ramp in background.
boat-ramp in background.
The rocks above (and in places beside) the sewer have been exposed to drying when the tide is not fully "in" and the sand is "out". This change in level of the surface of the rock it was buried in may be seen most obviously where there are manholes - see particularly the first manhole north of Bethshan where (when the sand is “out”) a gap beneath the concrete poured around it has developed.
The exposed rock platform at the NW end of the Beach
Long-time residents at the NW end of the Beach have photos from the 1970s showing the grey siltstone there well-covered with sand. This situation has not been seen (except as a very small volume of sand) for 20 years. The grey siltstone there does not undergo mechanical slaking when dried and re-wet. Its surface doesn't get any sand staying on it now. This may well be entirely the result of loss of sand along the whole Beach, and there does also appear to have been some tectonic uplift of the rock which is NOT susceptible to slaking. There is an obvious fault line between it and the adjacent slakeable (softer) siltstone immediately to the SE under the muds and sands exposed at low tide, so slow movement on the fault line might also account for some of it. Also, there appears to be some very recent bending in the concreted footpath and stone wall near the alignment of the fault line marking the boundary between the two geologies.
Why is the rock surface beneath the sand becoming lower - almost all along the Beach?
The above five observations lead to a question deserving careful consideration.
Why didn’t the siltstones under the sand slake down 50 yrs ago or 500 or ??? yrs ago?
The most credible answer I can think of is –
“because they didn’t then become exposed and dried at low tide”.
This means that either –
(a) The siltstone has risen relative to sea level (ie sea level has fallen relative to the siltstone) OR
(b) The siltstone was covered with much more sand in times past so it didn’t
become dry even when storms had moved much of it “out” OR
(c) Storms from the NE energetic enough to move beach sands didn’t occur until recently (2) OR
(d) The siltstones were intermittently slaking down (when exposed) but nobody was around to notice.
Possibility “b” is very likely even though it does not match memories of the 1950s (and earlier) when people (the undersigned for one) recall having difficulty walking on sand all the way from the central reserve to the Bethshan end of the Beach. It could well be that these memories are of times when the sand was “out” but it is certain that the sand was not at that time a continuous blanket over the siltstone at all times and tides. Maybe there was in the 1950s a major layer of shells and mud covering the slakeable siltstone. It would also imply that the Beach has (and has long had) a certain fixed amount of sand which belongs to it rather than the more modern understanding that sand migrates around coastlines and sits on beaches in amounts determined by rates of gains and losses to/from neighbouring stretches of coastal cliff and to/from deeper water. The effect of the constructed groins at Omaha Beach, Castor Bay and elsewhere give evidence of the longshore migrations of sands there.
It is my conclusion that tectonic movements (including bending of the Earth's crust along the Beach and on the coast around Kawau Bay) have altered the movement of sand (by subtly altering longshore currents) and that the effects of this are visible in the 20-year term.
Possibility “c” would imply a type of climate change which would have been observed elsewhere and would be at odds with common observation and indeed with common sense.
Possibility "d" exists but there are no prospects of evaluating its likely significance relative to the other three.
That leaves “a” which is in tune with many observations elsewhere in NZ. A tectonic rise of 1 or even 2 mmpa (mm per annum)would not be considered unlikely by most informed geologists. There is evidence of rates of tectonic rise of 0.3 - 1 mmpa on the west coast of Northland and of subsidence on its east coast.
There is a variety of evidence that large areas of the Southern Alps have been rising by about 12 mmpa for the last few thousand years. This has been ascribed to tectonics - the Pacific Plate pushing underneath the Australian Plate. And that 12 mmpa corresponds roughly with the (measured) rate at which rock and soil (gravels, sands, silts and clays) are presently being taken out to sea at the mouths of the rivers (3) flowing from the Alps to the sea. (It could well be that the Alps have reached an “equilibrium altitude” at which the rate they are being uplifted is roughly equal to the rate they are being eroded down. That may well change in the very long term.)
At many other places tectonic uplift has been detected and at a few (such as the Marlborough Sounds) tectonic sinking has been deduced. It would explain the poor development of beaches in those Sounds.
For significant amounts of slaking of siltstones beneath sands on beaches to occur the sand covering them must be taken out and stay out for long enough for them to be dried a bit and then re-wet. When dried just between tide ie for only a few hours, only a thin “skin” on the surface of the siltstone would be dried so the process must be repeated many times.
When Surveyors measure altitude they use “mean sea level” as the origin or datum. (Perhaps one day measurements of altitude from satellites will be accurate enough for the centre of the Earth to be used as the origin but in the past, and today, mean sea level is all that is available.) The statement “the land has been uplifted” is therefore the same as the statement “sea level has fallen”.
Measurements made on the survey datum and on the sea wall and of the gaps beneath portions of boat ramps and the sewer (especially the manholes) all suggest that the tectonic uplift rate (or rate of sea level fall) has been greater than 1 - 2 mmpa in recent decades.
There is no law which says that this rate should be the same every year. Some years it may be zero, or even negative, and in other years a lot higher. To suggest an average tectonic uplift rate of 2mmpa over a period of 50 years is not outrageous, and probably not unusual for Northland. The average of 12 mmpa deduced for the Southern Alps comes from a variety of evidence ranging from the ages of shingle screes and the patterns of plant growth (tussock etc) to the rate at which material (cobbles, sands, silts and clays) are swept out to sea at the river mouths. The variety of observations increases the credibility of the different types of evidence. The latter rate (erosion rate) and the uplift rate are about the same which means that the Alps are being worn down at about the same rate as they are being uplifted, so their altitudes remain about the same.
One must say “about the same” because everything is irregular in time and in position. Earthquakes must introduce changes in uplift rates of course, both as they occur and subsequently. The very large number of fault lines shown on geological maps of NZ show that the Earth’s crust has been not only deforming but breaking, with the pieces on the two sides of the breaks moving relative to each other.
Layers of the Earth’s crust undergo not only breaking (faulting) but tilting and bending as may be seen in many cuttings for roads and even farm tracks throughout NZ. See The Rocks article.
A straight-line boundary between softer and harder grey siltstones is visible on the sea floor at the NW end of the Beach. The rock sea-wall there which had 12 cubic meters of concrete added behind it in 2000 already shows cracking which could well be the result of bending of the Earth’s crust in this part of the Beach, with or without some “creeping” movement on the fault line.
Is sea level fall evidenced on other beaches in NZ?
One feature which suggests possible tectonic rise (ie sea-level fall) at Algies is the disintegration of the siltstones by mechanical slaking. Algies Bay is the only one I’m aware of where such rocks come right down to the sea, though such rocks cover a large area in East Cape/Hawkes Bay. In the South Island they occur only in a small area in North Canterbury.
Less clear evidence suggests uplift where wave-cut platforms of harder rock such as Greywacke emerge at low tide showing that the rate of uplift is greater than the rate at which the waves are cutting those hard rocks down.
Concluding remarks
At Algies Bay over the last 50 years, the siltstone beneath the sand has fallen relative to the land by about 300mm, ie at an average rate of about 6 mmpa in some places along the Beach. However, the fact that the "obstruction to boating" created by the survey datum becoming 100mm higher than the rock around it, the appearance of the piles beneath the concrete wall at the central Reserve, the lowering of the siltstone "sea-bed" below the 1995 rock wall, the emergence of the stone-paved sewer and the steps appearing at the lower ends of boat-ramps have all become quite suddenly more noticeable in the last 8 years, ie since about 2007. The average rate of lowering of the rock surface beneath the Beach sand might well have increased from a low rate of (say) 1 mmpa in the 1960s to perhaps 20 mmpa in some recent years.
My observations of high tide levels on the boat-ramp at 4 Gordon Craig Place suggest that most of the 300mm has been a lowering of the surface of the rock relative to the concrete ramp. High tides do not advance noticeably higher up the ramp. Much depends on wind and waves.
All tectonic movements are irregular in time and in space, ie from year to year and from place to place. In many parts of NZ spatially variable tectonic movements have led to faulting of the rocks and in others to slow distortions of the ground and in yet others to earthquakes.
If referred to as “tectonic uplift” 1 mmpa would be regarded as an unremarkable rate, though rates of 0.3 to 1 mmpa have been widely observed on the west coast of Northland and a subsidence of up to 1 mmpa on the east coast.
If there is any sea level rise due to ice sheet melting due in turn to global warming it has not yet become evident in Algies Bay. I would find it easier to see a slight fall in sea level. However that may be, it is clear that tectonic distortions must be taken into account in the arithmetic leading to such conclusions.
Having written at some length above about tectonic movements I should add that they in turn are almost certainly driven by very slow and irregular convection currents in the magma beneath the Earth's crust, and (hold your hat) they in turn are driven by nuclear reactions taking place deep in the Earth's core, as evidenced by very faint radiation coming from some rocks such as Greywacke (4).
The evidence of the siltstone beneath the sand slaking down is undeniable. Whether this has (and is) occurring as a result of tectonic rise (sea level fall) is not certain but it is arguably the simplest explanation (and simple explanations do tend to be right, or at least significant).
The fact that a tectonic rise averaging 1 or 2 mmpa over a period of 50 years would not be remarkable raises the question “Why bother to deduce this?” The author has done so because there is widespread belief that global warming causing the ice and snow on Greenland, Siberia and the Antarctic to melt will cause sea level to rise relative to the land masses and very little publicized discussion on changes in sea level due to tectonic movements.
The melting of the ice and snow on Greenland, Siberia and the Antarctic would certainly mean that an increased amount of the H2O on the Planet would be in liquid and gaseous form (in the sea and as water vapour in the air respectively) rather than in solid form (as ice and snow) but having more of it as sea water is not the only driver of sea level relative to land masses, and changes in greenhouse gas quantities are not the only driver of climate change.
Unsteady patterns of magma circulation beneath the Earth's crust must be a major cause of both tectonic movements and climate changes. Changes in the shape of the floors of oceans would allow them to hold more (or less) water without there being changes in sea leavel relative to the masses of dry land.
Causes of the loss of sand on the Beach have been the subject of much speculation over the last few decades. Reflection of wave energy by concrete walls does appear to be one factor. The moving of the sea walls (both the concrete and the imported rock ones) seawards is another. Piping of rainwater from house roofs and sealed roads onto the Beach is yet another.
The lower floor of our own house is 7m above MHWS and the change in sea level relative to the concrete boat-ramp and the floor of the boatshed in the last 19 years has been small. Sea level change does not rank high on my list of anxieties.
This set of short articles on geotechnical considerations relevant to Algies Bay scratches the surface of many disciplines including "coastal processes" and "fluid mechanics" as well as geology.
John Hawley
November 2015
Recommended reading – “In search of ancient New Zealand" by Gerard Hutching and Hamish Campbell, Chapter 2 The Earth's Crust
1. John F Rogers
2. Say ‘prior to European times’.
3. Eg Waimakariri, Selwyn, Rangitata
4. So much for nuclear-free NZ!!!
2. Say ‘prior to European times’.
3. Eg Waimakariri, Selwyn, Rangitata
4. So much for nuclear-free NZ!!!
